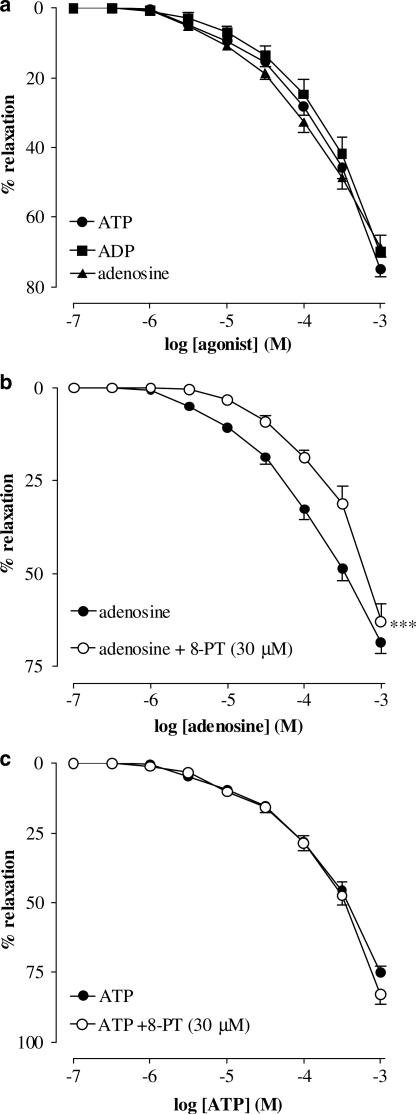
Figure 1.
Cumulative concentration–response curves to ATP, ADP and adenosine on AVP (10 nM) precontracted urethral strips. (a) Concentration–response curves to ATP, ADP and adenosine (all from 0.1 μM to 1 mM). (b) Concentration–response curves to adenosine in the absence and presence of 8-PT (30 μM). (c) Concentration–response curves to ATP in the absence and presence of 8-PT (30 μM). All points show the mean±s.e.m. of eight experiments, unless occluded by the symbol. ***P<0.001 following a two-way ANOVA and Tukey's post hoc test.

