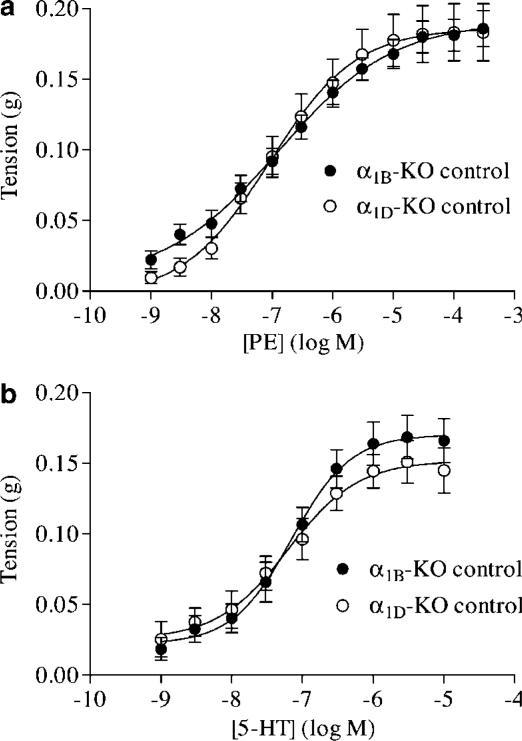
Figure 1.
Mean concentration response data to (a) PE and (b) 5-HT in α1B-KO and α1D-KO control mouse carotid arteries expressed as tension in grams. Both agonists produced similar responses in the two strains of control mice. Mean curves were generated using nonlinear regression upon which the mean±s.e.m. data have been superimposed (n>9).

