Figure 2.
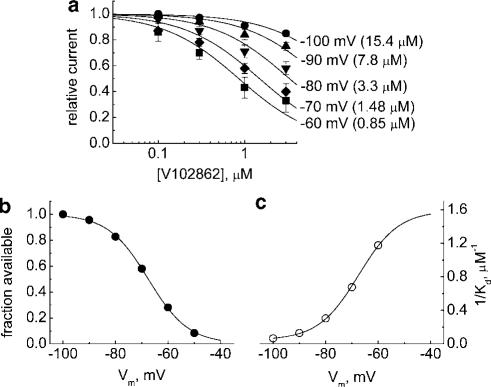
(a) Dose–response curves for inhibition of INa in hippocampal neurons by V102862 (0.1–3 μM) at different holding membrane voltages from −60 to −100 mV. The data are means±s.e.m. with n=3–5 for each concentration point. The lines are sigmoidal curve fits, 1/(1+([V102862]/KD)), to experimental mean values, where [V102862] is the concentration of V102862 and KD is the apparent dissociation constant. The KD values are 0.85 μM (−60 mV), 1.48 μM (−70 mV), 3.3 μM (−80 mV), 7.8 μM (−90 mV) and 15.4 μM (−100 mV), correspondingly. (b) Mean steady-state inactivation (availability) curve for Na channels in hippocampal neurons. The individual curves were taken by a series of 100 ms long depolarizing conditioning pulses followed up by a 15 ms test pulse to −10 mV. The points are an average of individual points taken from four distinct neurons (the arrow bars are omitted for the sake of clarity). The line is the fit of Boltzmann function, 1/[1+exp((V+67.5)/7.66)], where V is the conditioning voltage. (c) The apparent affinity of V102862, expressed as 1/KD, plotted against the holding potential. The KD values were taken from sigmoidal curve fits in (a). The line is a Boltzmann function, 1/KD=1.59/[1+exp(−(V+67.5)/7.66)], which, as predicted by the model (Kuo & Bean, 1994), is approximately a mirror image of the inactivation curve in (b).

