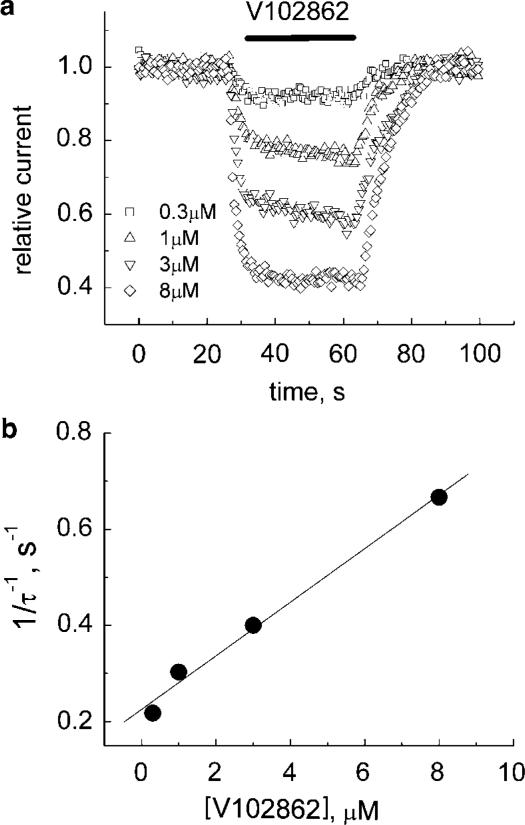
Figure 3.
(a) Onset and recovery from inhibition by V102862 at −80 mV. The cell was voltage-clamped at −80 mV and 200 pulses (each 5 ms in duration) were generated to −10 mV at 2 Hz. After approximately 25 s (base line), V102862 was applied via a fast solution exchange shooter for about 30–35 s. This was followed up by 30–35 s long wash interval. The protocol was repeated with increasing concentrations of V102862 every 2–4 min. The peak currents were normalized to mean current in control (before fast application of the drug) and plotted vs time. The superimposed time courses of inhibition are presented for four different concentrations of V102862. Mono-exponential fits (not presented) to both onset and recovery from inhibition returned the following time constants, correspondingly: 4.6 and 5.8 s for 0.3 μM (squares); 3.3 and 6.1 s for 1 μM (up-triangles); 2.5 and 7.8 s for 3 μM (down-triangles); and 1.5 and 7.5 s for 8 μM (diamonds). (b) The reciprocal of blocking time constant is plotted against V102862 concentration. The solid line is the best least-square fit with a slope of ∼0.06 μM−1 s−1.

