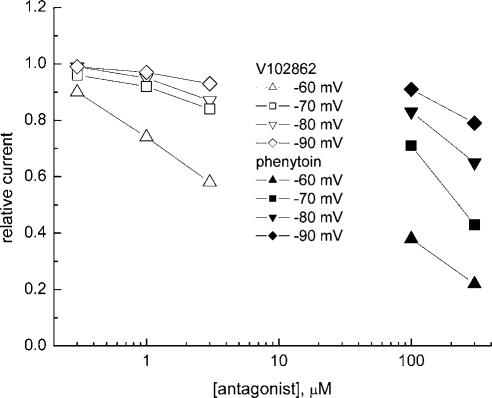
Figure 4.
Partial dose–response curves for inhibition of INa by 0.3–3 μM V102862 (open symbols) and 100 and 300 μM PHT (solid symbols) taken in the same hippocampal neuron at different holding membrane voltages of −60, −70, −80 and −90 mV. Partial, two point inhibition–concentration curves for PHT are consistently shifted to the right for all holding voltages tested (from −60 to −90 mV), indicating significantly (10- to 30-fold) lower potency of the drug as compared to V102862. Similar shifts in potencies were measured in seven more neurons.

