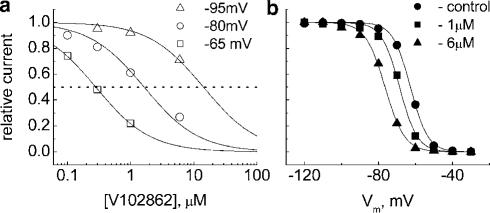
Figure 6.
(a) Effects of membrane holding voltage on block of Na+ currents by 0.1–6 μM V102862. Na+ currents were elicited by pulsing to 0 mV, from holding potentials of −95, −80 or −65 mV. The lines were drawn according to the Hill equation with KD values of 15.9, 1.64 and 0.28 μM, respectively, and the slope fixed at 1.0. (b) Normalized inactivation curves measured with 5 s long prepulse. The cell was held at −120 mV and given an inactivating conditioning prepulse from −120 to −30 mV, immediately followed by 5 ms testing pulse to 0 mV every 15 s. The lines are fits to a Boltzmann function, 1/[1+exp((V−Vhalf)/k)]. The Vhalf and k values were −62.7 and 4.8, −68.6 and 4.8 and −76.5 mV and 5.3 mV in control, 1 μM V102862 and 6 μM V102862, respectively.

