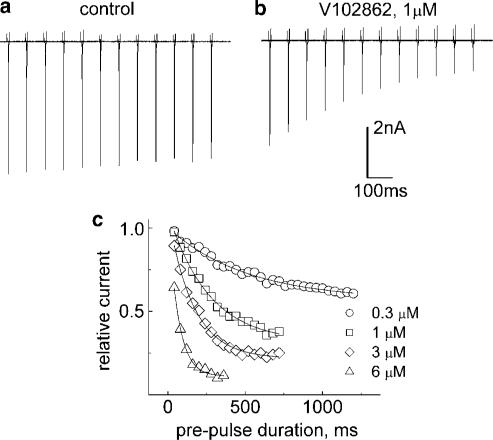
Figure 8.
The binding rate of V102862 to inactivated rNav1.2 channels. (a) Control: the cell was pulsed for variable times (in increments of 80 ms) to −20 mV from the holding voltage of −120 mV every 15 s. Gap voltage (−120 mV, 5 ms) was applied after depolarizing prepulse to recover most inactivated and unliganded channels (see Figure 7a). The 10 ms testing pulse to 0 mV gave a measure of channels available for activation. A total of 12 successive traces (episodes) were superimposed; downward deflections represent inward Na currents evoked by test pulses in successive episodes. In control, only a slight tendency of currents to drop in size with increasing duration of conditioning prepulse is apparent. (b) Same protocol in the presence of 1 μM V102862. Progressive drop in the size of current over time reflects increase in the proportion of Na+ channels bound (and inhibited) to V102862. The mono-exponential fit to the peak current amplitudes (corrected for decay in control) returns the time constant, τ, and the steady-state level of inhibition. (c) Corrected time course of binding for 0.3, 1, 3 and 6 μM V102862 (different cell). The differences between the currents measured in the presence of the drug and the currents in control were normalized and plotted against the duration of conditioning prepulse. The lines are the mono-exponential fits. The time constants and the fractional responses in steady state are as follows: 511 ms and 0.57 (0.3 μM), 263 ms and 0.32 (1 μM), 163 ms and 0.22 (3 μM) and 65 ms and 0.11 (6 μM).

