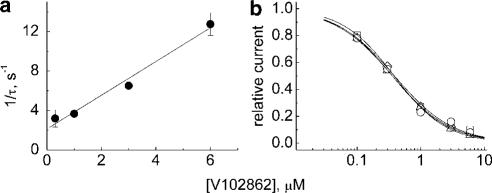
Figure 9.
(a) The macroscopic binding rates for V102862 (the inverses of the time constants as measured in Figure 8c) taken from four cells and plotted against concentration of the drug. The line is linear regression fit to mean values. The slope is ∼1.7 μM−1 s−1 and numerically equal to the pseudo-first-order constant k+ of V102862 binding to inactivated Na+ channels. (b) A set of semilogarithmic concentration–inhibition curves for inhibition of Na channels by V102862 taken for conditioning (inactivating) prepulses to −20 mV in four different cells. Fractional responses were measured in steady state in the experiments like the one shown in Figure 8a and b. The curves are the best sigmoidal curve fits to the data points: 1/{1+([V102862]/0.38)1.06}, 1/{1+([V102862]/0.39)0.94}, 1/{1+([V102862]/0.36)0.98} and 1/{1+([V102862]/0.36)0.95}.

