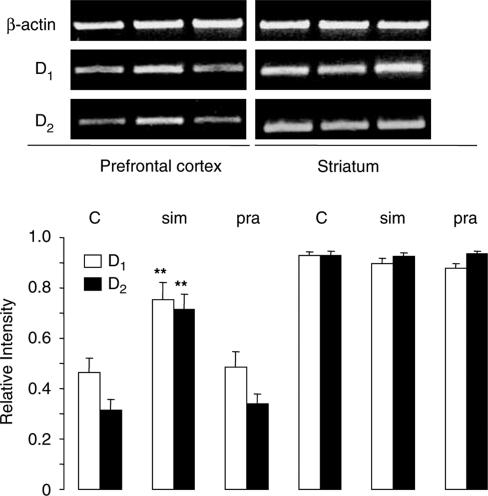
Figure 2.
Expression of mRNA of D1 and D2 receptors in the prefrontal cortex and striatum of saline-, simvastatin- and pravastatin-treated rats. RT–PCR showed that simvastatin (sim, 30 mg kg−1 day−1), but not pravastatin (pra, 30 mg kg−1 day−1), increased D1 and D2 receptor mRNA expression by 1.6- and 2.2-fold, respectively, in the prefrontal cortex when compared to the saline-treated control (C) group. No changes were observed in the striatum. Graphs showed band intensity relative to the corresponding β-actin band. Error bars represent s.e.m., n=6 per group. One-way ANOVA: F(2,27)=6.641, P<0.005 for D1 and F(2,15)=21.460, P<0.001 for D2 in the prefrontal cortex. **P<0.01 by post hoc analysis with Bonferroni correction. Top panel shows typical bands of β-actin, D1 and D2 receptors in the same order (left to right) as presented in the graph.

