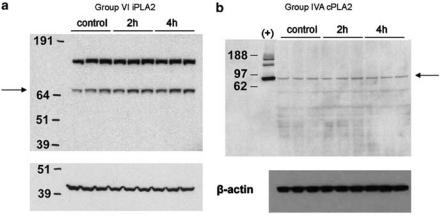
Figure 2.
Western blots of Group VI iPLA2 and Group IVA cPLA2 protein expressed in rat lumbar spinal cord. (a) Top: α-Human Group VI iPLA2 antibody; bottom: β-actin loading control. Lane (1) molecular weight marker (numbers indicate molecular masses in kDa), lanes (2–4) control rat, lanes (5–7) 2 h carrageenan, and lanes(8–10) 4 h carrageenan. (b) Top: α-Group IVA cPLA2 antibody; bottom: β-actin loading control. Lane (1) molecular weight marker (numbers indicate molecular masses in kDa), lane (2) (+) purified human Group IVA cPLA2, lanes (3–5) control rat, lanes (6–8) 2 h carrageenan, and lanes (9–11) 4 h carrageenan.

