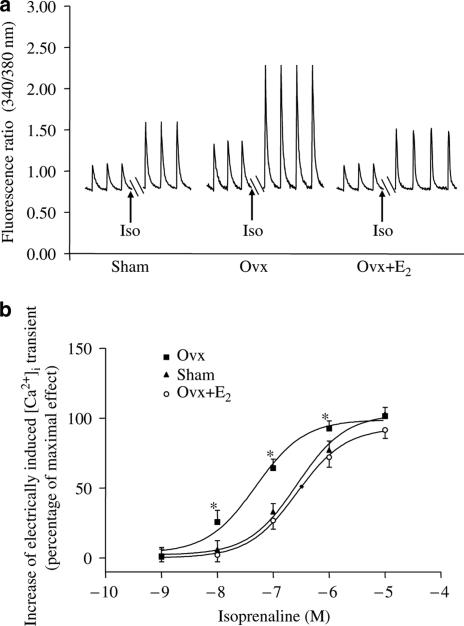
Figure 9.
Concentration-related effects of Iso on E[Ca2+]i in ventricular myocytes from control, Ovx, and Ovx+E2 rats. (a) Representative traces showing the effect of 100 nM Iso and (b) concentration–response curve. Y-axis represents percentage of maximal effect. The effect of 10 μM Iso stimulation on E[Ca2+]i in sham rats was taken as 100. Values are mean±s.e.m. N=15–24 cells from three different rats in each group. *P<0.05 vs corresponding value in the control group.

