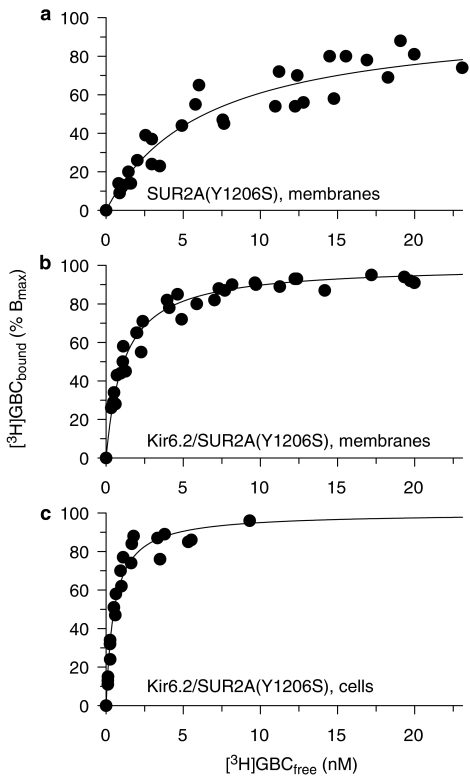
Figure 2.
Saturation of [3H]GBC binding to SUR2A(YS) in membranes (a, b) and cells (c). Data represent normalised specific binding pooled from three to four experiments. Binding is to SUR2A(YS) expressed alone (a) and to Kir6.2/SUR2A(YS) (b, c). Experiments in membranes were performed in the presence of MgATP (1 mM). Individual experiments were evaluated according to equations (4) and (5) in Methods section; mean parameters of specific binding are listed in Table 2. Nonspecific binding was given by equation (5) with a=39±2, 32±2 and 67±2 fmol mg−1 nM−1 for SUR2A(AS) and Kir6.2/SUR2A(YS) in membranes and cells, respectively.

