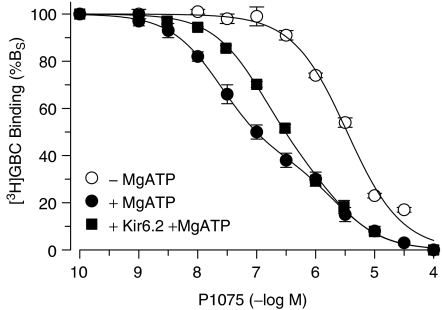
Figure 3.
Inhibition of [3H]GBC binding to SUR2A(YS) by P1075: effect of MgATP (1 mM) and of coexpression with Kir6.2. Data are means±s.e.m. from four to five independent experiments and are expressed as % specific binding (%BS). Mean fitting parameters obtained from the analysis of the individual inhibition curves are listed in Table 1. BTOT values, determined at [3H]GBC concentrations of 2.5–1.5 nM, ranged from 440 to 200 fmol mg−1 and nonspecific binding from 50 to 20% of BTOT.

