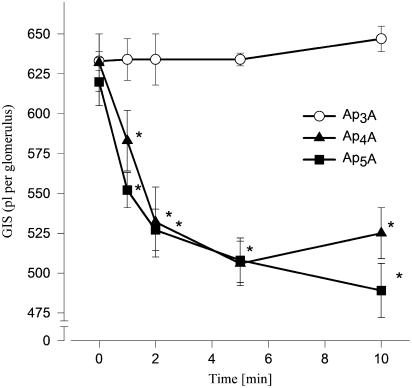
Figure 2.
Time–response curves illustrating the constrictor effects of ApnAs on GIS. Glomeruli were incubated with 1 μM Ap3A (open circles), Ap4A (filled triangles) or Ap5A (filled squares) for the indicated time. Results are expressed as the mean of absolute values±s.e.m. for n=4–5 experiments. *P<0.05 agent vs basal value.

