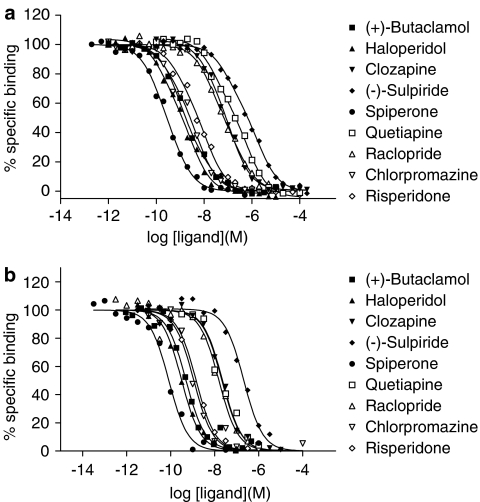
Figure 2.
Binding of inverse agonists to dopamine D2 receptors expressed in CHO cells. Inverse agonist binding was determined in competition versus (a) 1 nM [3H]NPA or (b) 1 nM [3H]NPA and 100 μM GTP, as described in Methods section. Data in (a) were best fitted by a two-binding site model, while those in (b) were best fitted by a one-binding site model. Curves shown are representative examples of data replicated as in Table 1.

