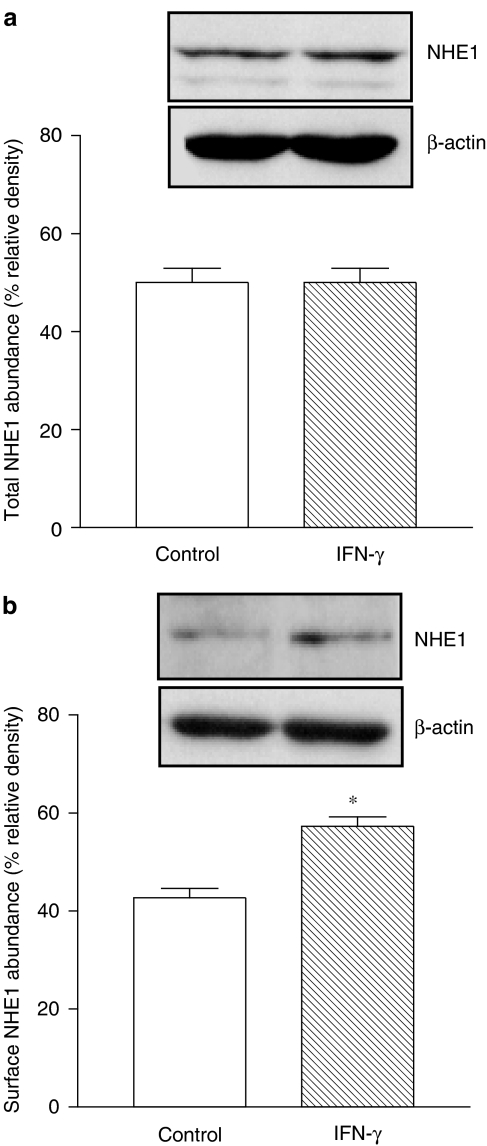
Figure 3.
Abundance of (a) total NHE1 and (b) surface NHE1 in Caco-2 cells treated for 24 h with IFN-γ (1000 U ml−1). Western blots were repeated 4–6 times. Columns indicate relative density and represent the mean of five separate experiments; vertical lines indicate s.e.m. values. *P<0.05, values significantly different from corresponding control values using the Student's t-test.

