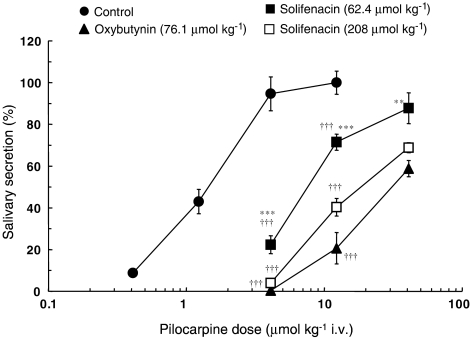
Figure 3.
Effects of oral administration of oxybutynin and solifenacin on the dose–response curve of pilocarpine-induced salivary secretion in mice. Mice received cumulative intravenous doses (0.41–40.9 μmol kg−1) of pilocarpine at 5-min intervals from 0.5 h after oral administration of oxybutynin (76.1 μmol kg−1) and 2 h after oral administration of solifenacin (62.4, 208 μmol kg−1), and then their total saliva was collected. Each point represents the mean±s.e.m. of four to nine mice. Daggers show a significant difference from each control value, †††P<0.001. Asterisks show a significant difference from each value of oxybutynin, **P<0.01, ***P<0.001.

