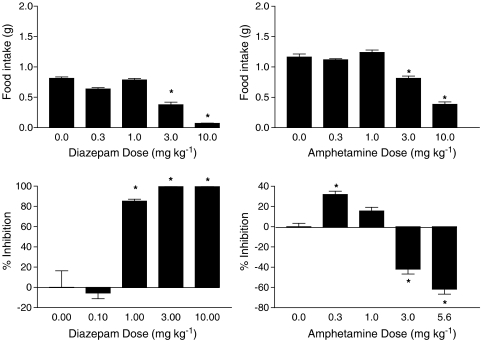
Figure 4.
Effects of diazepam (left panels) and amphetamine (right panels) on food intake (top panels) and % inhibition of locomotor activity (bottom panels). Bars represent the mean (±s.e.m.) of data from the same 10 mice across doses for food intake (but different mice for each drug) and data from 5–6 separate mice at each dose of each drug for assessment of locomotor activity. * indicates significant difference from vehicle control (P<0.05).

