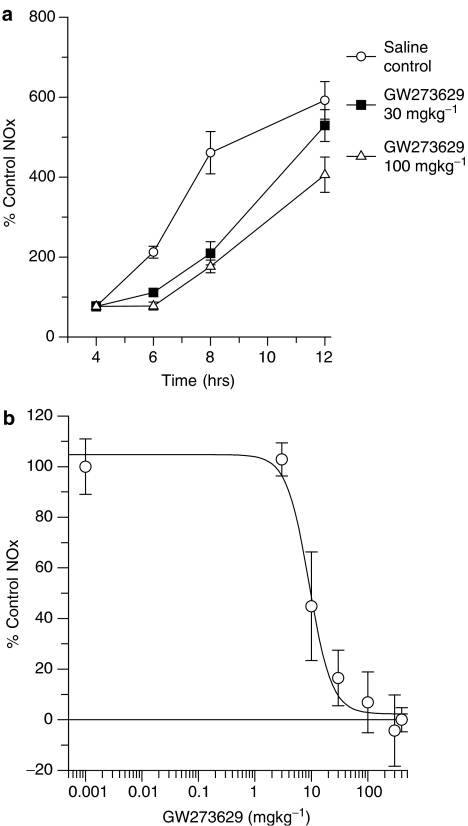
Figure 5.
Effect of GW273629 i.v. on LPS-induced elevation of mouse plasma NOx. (a) The time course of effects of GW273629 i.v. on LPS-induced elevation of mouse plasma NOx over 12 h. LPS was dosed at zero time and GW273629 was dosed at 4 h. (b) Dose response to GW273629 on plasma NOx. LPS was dosed at zero time and GW273629 was dosed at 4 h. Plasma was sampled at 6 h. The data shown are means±s.e.m. from four mice except 6 h LPS control which is an average and a range for two values. The 6 h LPS control NOx (for convenience of presentation plotted at 0.001 mg kg−1) was 335±20 μM and the 4 h LPS control value (for convenience of presentation plotted at 400 mg kg−1) was 157±17 μM.

