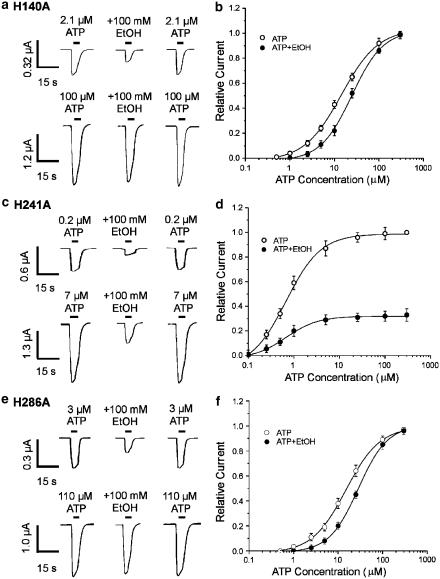
Figure 4.
Effect of ATP concentration on ethanol inhibition of ATP-activated current in the histidine-mutated rat P2X4 receptors expressed in Xenopus oocytes. (a) Records showing currents activated by 2.1 μM ATP (upper traces) and 100 μM ATP (lower traces), before, during and after the application of 100 mM EtOH in a single oocyte expressing the H140A mutant. (b) Graph plotting the amplitude of ATP-activated current in the presence of 100 mM EtOH relative to the amplitude of ATP-activated current in the absence of EtOH, as a function of ATP concentration. EtOH significantly increased the EC50 value for the ATP concentration–response curve from 14±1.8 μM in the absence of EtOH to 23.9±3.4 μM in the presence of 100 mM EtOH (ANOVA, P<0.01). (c) Records showing currents activated by 0.2 μM ATP (upper traces) and 7 μM ATP (lower traces), before, during and after the application of 100 mM EtOH in a single oocyte expressing the H241A mutant. (d) Graph plotting the amplitude of ATP-activated current in the presence of 100 mM EtOH relative to the amplitude of ATP-activated current in the absence of EtOH, as a function of ATP concentration. EtOH significantly decreased Emax of the ATP concentration–response curve by 67±1.1% (ANOVA, P<0.01), but did not significantly alter the EC50 value of the ATP concentration–response curve (P>0.05). (e) Records showing currents activated by 3 μM ATP (upper traces) and 110 μM ATP (lower traces), before, during and after the application of 100 mM EtOH in a single oocyte expressing the H286A mutant. (f) Graph plotting the amplitude of ATP-activated current in the presence of 100 mM EtOH relative to the amplitude of ATP-activated current in the absence of EtOH, as a function of ATP concentration. EtOH significantly increased the EC50 value for the ATP concentration–response curve from 15.4±2.1 μM in the absence of EtOH to 28.4±3.5 μM in the presence of 100 mM EtOH (ANOVA, P<0.01). In (b), (d) and (f), the amplitude of current activated by various concentrations of ATP in the absence and presence of EtOH is plotted as fraction of the current activated by 300 μM ATP in the absence of EtOH; this was determined for each cell studied. Each data point is the average current from 4 to 8 cells. As ATP sensitivity was different for each mutated receptor, ATP concentrations that were close to the EC10 and EC90 values of each ATP concentration–response curve were used in (a), (c) and (e) (2.1 and 100 μM for H140A, 0.2 and 7 μM for H241A, 3 and 110 μM for H284A, respectively).

