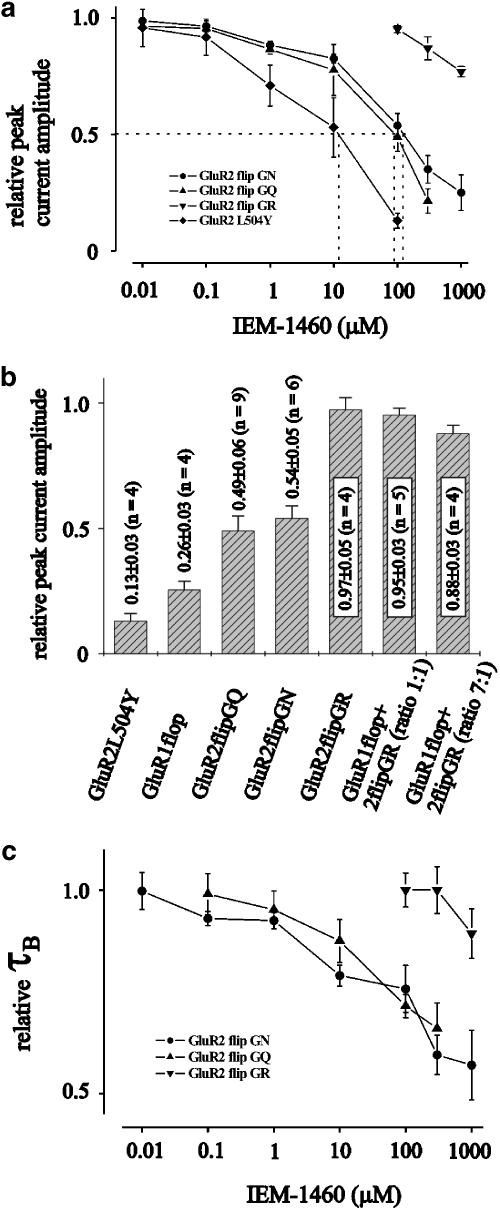
Figure 2.
Dose inhibition curves of different experiments of the type shown in Figure 1. (a) Inhibition of the relative peak current amplitudes elicited by 100 ms pulses of 10 mM glutamate after preincubation of outside-out patches from HEK293 cells containing GluR channels as indicated with different concentrations of IEM-1460. Each point is the average value of at least five independent experiments. (b) Average block of currents elicited by 100 ms pulses of 10 mM glutamate after preincubation of outside-out patches from HEK293 cells by 0.1 mM IEM-1460. Each point is the average of at least five independent experiments. (c) Relative decrease of τB of currents elicited by 100 ms pulses of 10 mM glutamate after preincubation of outside-out patches from HEK293 cells containing GluR2 as indicated with different concentrations of IEM-1460. Each point is the average value of at least five independent experiments.

