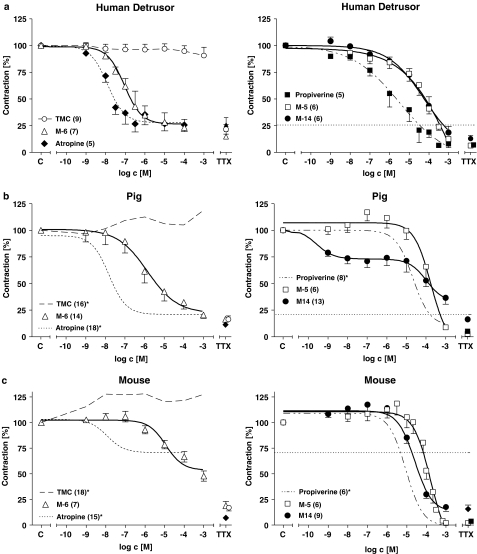
Figure 2.
Average CRCs for the effects of M-5, M-6 and M-14 in comparison to those of propiverine and atropine on EFS-evoked contractions in detrusor muscle from man (a), pig (b) and mouse (c). Force is expressed in percent of the pre-drug control value (=100%). TMC, time-matched control without any drug added. The horizontal dashed lines in the right side of the figure represent the contraction amplitude in the presence of the highest atropine concentration. The percent of direct smooth muscle contractions in the presence of 1 μM TTX is plotted for each experimental group on the far right of each diagram. Mean values±s.e.m. from n experiments. *Labelled data in pig and mouse were taken from previous work and are included for comparative purposes (Wuest et al., 2002).

