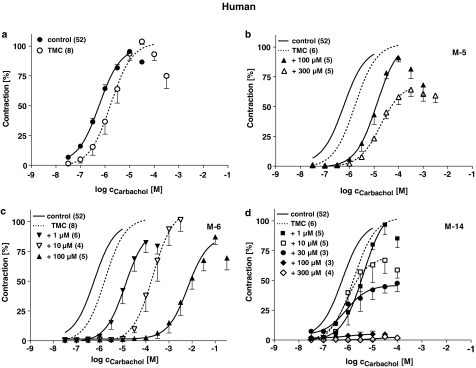
Figure 3.
Effects of M-5 (b), M-6 (c) and M-14 (d) on cumulative CRC for CCh in human detrusor muscle strips in comparison to TMC experiments without any drugs added (a). Data are shown as means±s.e.m. from n experiments. Responses to CCh are expressed in percent of the maximum effect in the first CRC. Note that the continuous and dashed lines have been fitted to the mean values without considering the decline of force at very high concentrations. Control data in (a) are averaged values from the first CRC's in all experiments (n=46, continuous line) and are also together with the TMC data (dashed line) depicted in (b), (c) and (d) without data points.

