Figure 6.
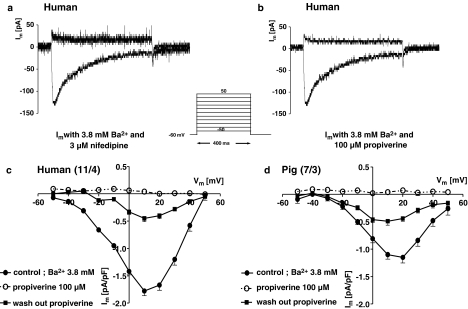
Current traces for the ICa in human DSMC in the presence of 3 μM nifedipine (a) and 100 μM propiverine (b). Current–voltage relations (I–V) for human (c) and porcine cells (d). Data of the I–V curves are shown as means±s.e.m. in pA pF−1 from n investigated cells. Effect of 100 μM propiverine on the I–V curves and washout are shown.

