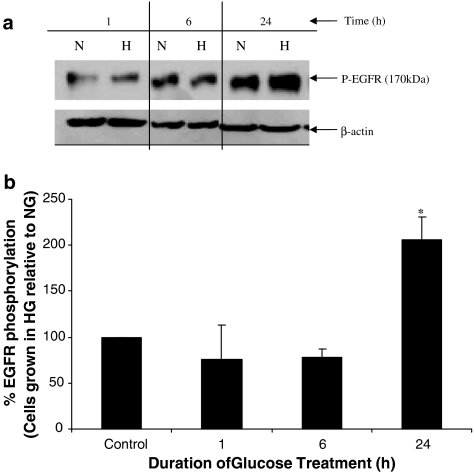
Figure 9.
Time course of EGFR phosphorylation in cultured ECV-304 cells grown in high glucose conditions. Cells were grown in either media containing 5.5 mM (Normal, N) or 25.5 mM high gluose media (H) for the stated times and EGFR phosphorylation relative to actin levels was monitored. (a) Western blot of pEGFR and β-actin for cells grown in N or H glucose is shown, whereas (b) a histogram of the densitometric analyses of the blots expressed as % of the normal (N) controls is shown. *Indicates a significant elevation in pEGFR relative to control.

