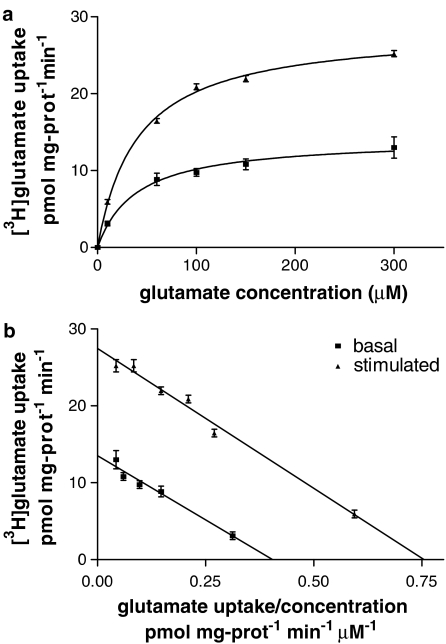
Figure 2.
(a) Saturation curves of glutamate transport in control (black squares) and glutamate-stimulated (100 μM/60 min; black triangles) platelets. (b) Eadie–Hofstee plots. Glutamate treatment induced a significant increase in Vmax (control: 11.7±0.5 vs stimulated: 16.2±0.9 pmol mg-proteins−1 min−1; P<0.01, Student's t-test; n=5) without changing the Km value (33.5±2.7 vs 35±4.7 μM, respectively, for control and stimulated platelets).

