Figure 4.
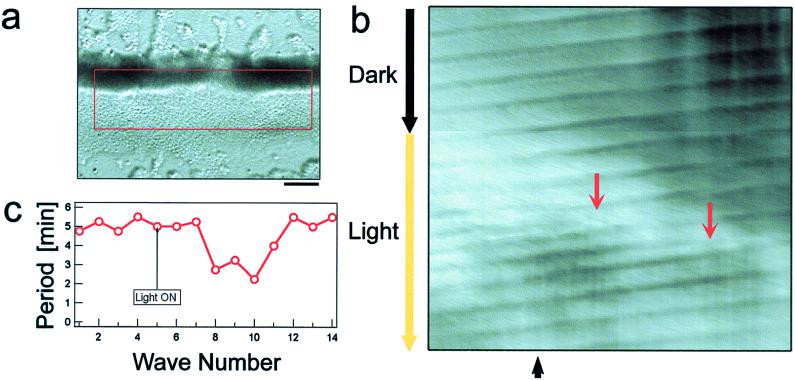
Light induces the formation of new cAMP waves in aggregation streams. (a) A bright-field image of an aggregation stream. The red square indicates the window that was used for time-space plot acquisition. (b) Time space plot showing dark-field waves propagating from right to left along the stream. The x axis corresponds to the length of the stream in the red window in a. Intensity of vertical one-pixel-wide column in red window was averaged for each column along the length of the stream and then the average values were represented in single pixels in b. This procedure resulted in a horizontal bar with one-pixel height and the width of the red window. The procedure was repeated for every frame of the sequence and the bars were aligned from top to bottom along the y axis to show the temporal change in the position of dark-field wave along the length of the stream. Thus, tilted dark lines in the figure show the change in the position of dark-field waves within the stream. Images were taken every 20 sec. Light irradiation was started at a time point indicated at the left side of the time-space plot and was confined to the region under the illumination field of microscope. Upon light irradiation, new waves formed (red arrows). The spacing between dark-field waves corresponds to the period of each wave. Periods were measured at the position indicated by the black arrow at the bottom of the figure and were plotted in the graph (c). (Bar = 0.2 mm).

