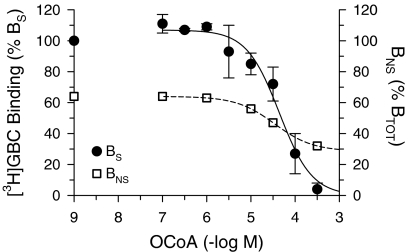
Figure 7.
Effect of OCoA on specific (BS) and nonspecific (BNS) binding of [3H]GBC to SUR2A(Y1206S). Data are means±s.e.m. from six to eight experiments performed in the presence of MgATP (0.3 mM) and at a [3H]GBC concentration of 2.3 nM. BS (solid curve) is normalised to 100% specific binding in the absence of OCoA. Owing to the stimulation of BS at [OCoA]⩽1 μM, the curve starts above 100%. The fit of the Hill equation to the descending part of the individual inhibition curves gave the parameters listed in Table 2. BNS (broken curve): OCoA decreased BNS from 65 to 30% of BTOT (109±6 fmol mg−1) with IC50=35 μM.

