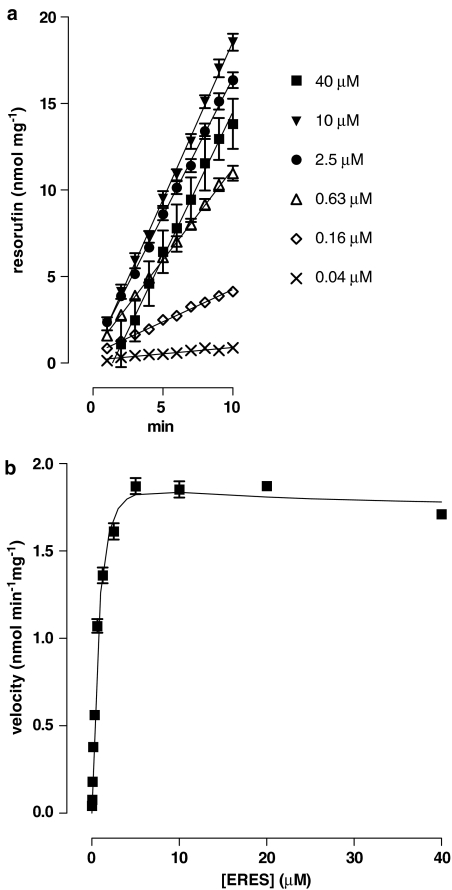
Figure 1.
Effect of the concentration of ERES on EROD activity in liver microsomes from 3MC-treated rats. (a) The time course of formation of resorufin from ERES was determined at 12 concentrations of substrate by determining the fluorescence intensity every minute for 10 min as described in Methods. For clarity, results from only six concentrations are shown. Lines are linear least-squares regressions. (b) Concentration/velocity plot using the full concentration range. The line shows the fit of the data to equation (3iii). The Ks for this experiment was 1.8 μM, Vmax was 4.5 nmol min−1 mg−1, β was 0.38 and α was fixed at 1. Each point represents the mean±s.e.m. of quadruplicate observations in a single experiment. Mean values from five such experiments using 10 or 12 concentrations of ERES are given in the text.

