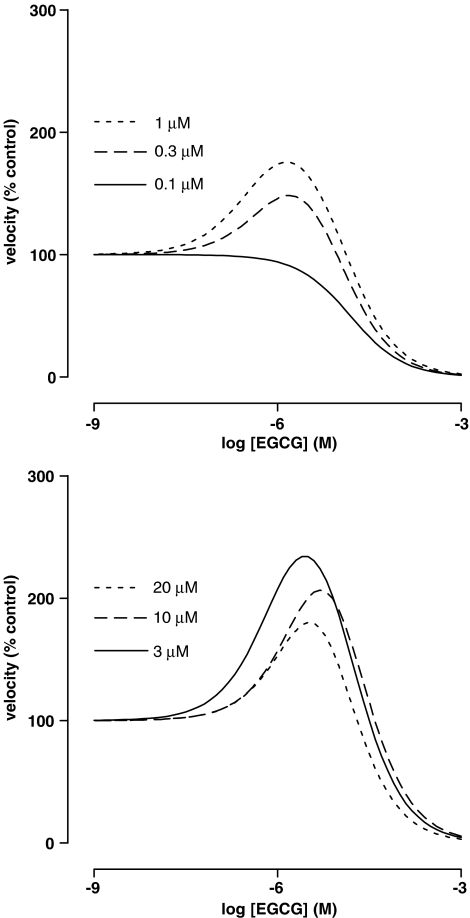
Figure 5.
Dependence of the effect of EGCG on EROD activity in liver microsomes from 3MC-treated rats on the concentration of ERES. The velocity of the deethylation of ERES in the presence of 11 different concentrations of EGCG was determined as described in Methods. Lines were obtained by reverse fitting of the mean data from Table 4 to equation (6) as described in Methods.

