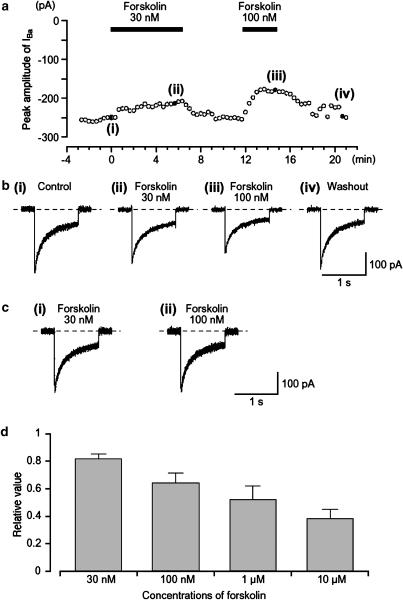
Figure 2.
Effects of forskolin (30 and 100 nM) on IBa in a conventional whole-cell recording. (a) The time course of inhibition of the peak amplitude of IBa produced by the application of forskolin (30 and 100 nM) is shown. Time 0 indicates the time when 30 nM forskolin was applied. Inward current were elicited by voltage steps (1 s duration) to +10 mV from a holding potential of −70 mV every 20 s. The cell capacitance was 39 pF. (b) Examples of inward current traces recorded at the indicated points in (a) are shown in ((b) (i)–(iv)). (c) The time course of the current decay IBa was identical when the current traces of IBa in the absence and presence of forskolin (30 and 100 nM) were superimposed. (d) It shows the relationship between different concentrations of forskolin and the normalized peak amplitude of IBa when the peak amplitude of IBa was taken as one just before application of each concentration of forskolin; each column indicates the mean of 4–9 observations with +s.d. shown by vertical lines.

