Figure 5.
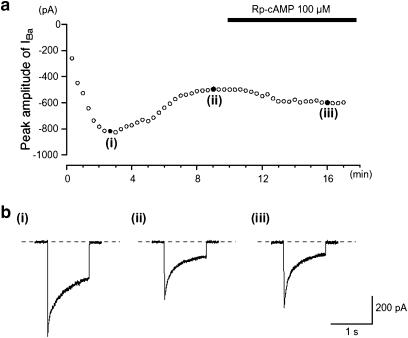
Effects of dialysing cells with the catalytic subunit of PKA on IBa. The cell capacitance was 49 pF. (a) The time-dependent changes observed in IBa using patch pipette, which contained the catalytic subunit of PKA (125 U ml−1), are shown. The ordinate scale shows the peak amplitude of IBa evoked by a depolarization pulse (1 s duration) from a holding potential of −70 mV every 20 s. The abscissa scale indicates the time after formation of a conventional whole-cell recording. (b) Sample traces shows IBa recorded at the indicated points ((i)–(iii)) in (a).

