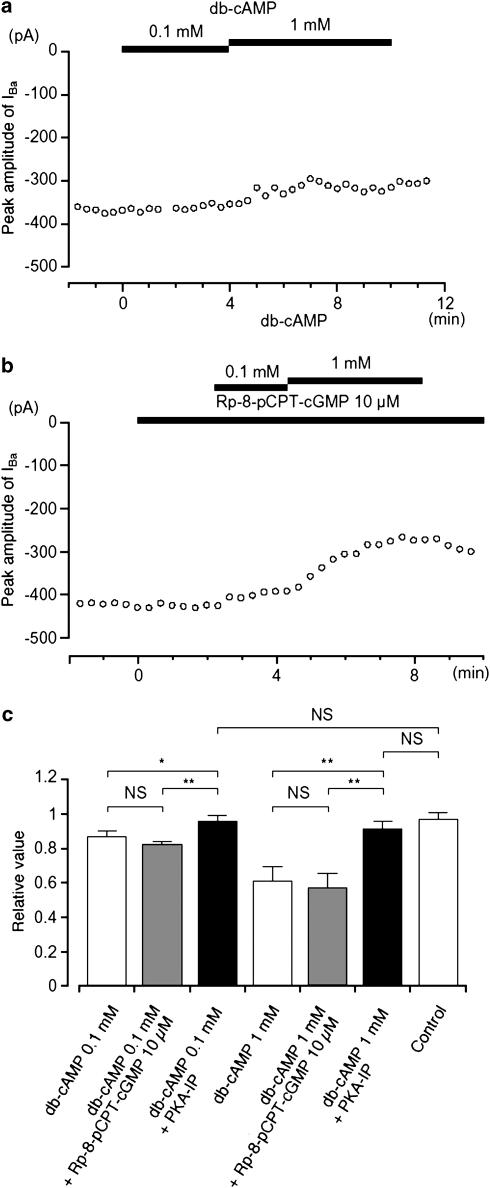
Figure 7.
Effects of db-cAMP (0.1 and 1 mM) on IBa using conventional whole-cell recording. (a) The time course of changes in the peak amplitude of IBa before and after application of db-cAMP (0.1 and 1 mM) when PKA-IP (1 μM) was included in the pipette solution. Time 0 indicates the time when 0.1 mM db-cAMP was applied. The cell capacitance was 36 pF. (b) Similarly, it shows that the peak amplitude of IBa was little changed by the application of db-cAMP (0.1 and 1 mM) in the presence of Rp-8-pCPT-cGMP. Time 0 indicates the time when 10 μM Rp-8-pCPT-cGMP was applied. The cell capacitance was 42 pF. (c) The effects are summarized. It can be seen that the selective inhibitor of PKA only inhibited the effects of cAMP analogues and that the selective inhibitor of PKG only inhibited the effects of cGMP, with no cross interaction being detected. Each column shows the mean of 3–6 observations with +s.d. shown by vertical lines. Asterisks indicate a statistically significant difference, demonstrated using a paired t-test (*P<0.05, **P<0.01).

