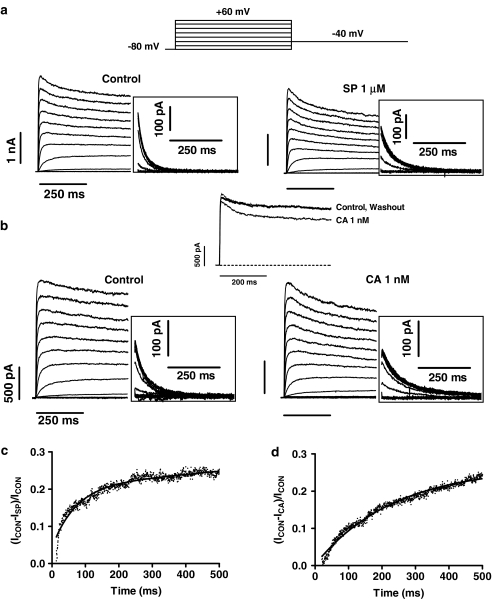
Figure 2.
(a, b) hKv1.5 current traces obtained with the voltage protocol illustrated in the upper part for control conditions and with 1 μM SP (a) or 1 nM CA (b). (c, d) Plot of the current ratio between the SP- and CA-sensitive currents during the pulse to +60 mV (ICON−ISP and ICON−ICA, respectively) and the current in control conditions. The continuous line in both panels represents the fit to a monoexponential function to obtain the τblock. SP, spironolactone; CA, canrenoic acid.

