Figure 4.
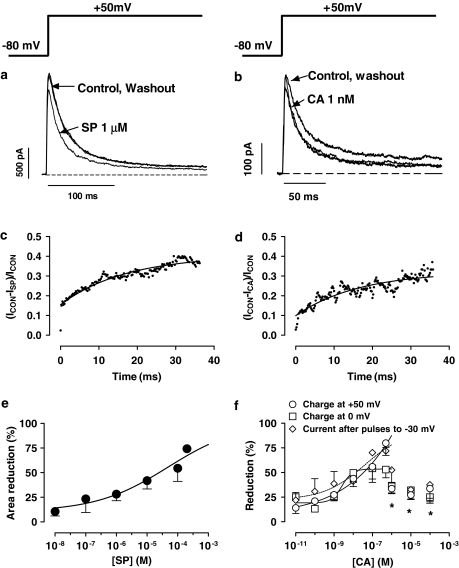
(a, b) Kv4.3 current traces obtained by applying 250-ms pulses to +50 mV in the absence, presence and after the washout of 1 μM SP (a) and 1 nM CA (b). (c, d) Plot of the current ratio between the SP- and CA-sensitive currents during the pulse to +50 mV (ICON−ISP and ICON−ICA, respectively) and the current in control conditions. The continuous line represents the fit to a monoexponential function to obtain the τblock. (e, f) Concentration-dependent effects of SP (e) and CA (f). In panel f, blockade has been measured as the reduction in the charge crossing the membrane after pulses to +50 and 0 mV or in the peak current amplitude obtained with pulses to +40 mV after prepulses to −30 mV. Data obtained between 0.01 and 500 nM were fitted using the Hill equation. *P<0.05 vs blockade obtained with 500 nM CA. In panels e, f, each point represents the mean±s.e.m. of >5 experiments.

