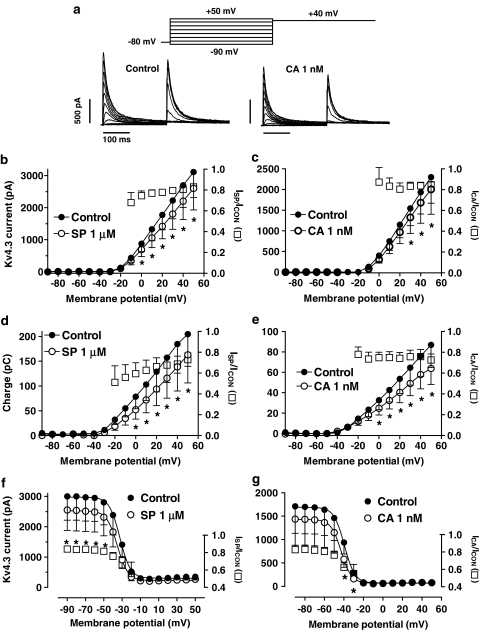
Figure 5.
(a) Kv4.3 current traces in the absence and in the presence of 1 nM CA obtained when applying pulses to potentials ranging from −90 to +50 mV followed by a 250-ms pulse to +40 mV. (b, c) Peak current–voltage Kv4.3 relationship in the absence and presence of SP (b) and CA (c). (d, e) Relationship between the current–time integral and the membrane potential in the absence and presence of SP (d) and CA (e). (f, g) Inactivation curves in the absence and presence of SP (f) and CA (g) obtained by plotting the peak outward current elicited by the test pulse to +40 mV as a function of the potential of the conditioning pulse. Continuous lines represent the fit of the data to a Boltzmann equation. In panels b–f, *P<0.05 vs control data. In panel g, *P<0.05 vs data obtained at −90 mV. In panels b–g, squares represent the fractional block as a function of the membrane potential and each point represents the mean±s.e.m. of 10 experiments.

