Figure 7.
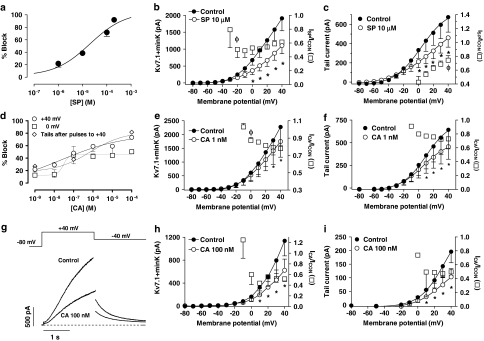
(a, d) Concentration-dependent effects of SP (a) and CA (d) on Kv7.1+minK currents. Data were fitted using the Hill equation. Each point represents the mean±s.e.m. of >5 experiments. (b, e, h) Averaged current–voltage Kv7.1+minK relationships 2-s isochronal in the absence and presence of 10 μM SP (b), 1 nM CA (e) and 100 nM CA (h). (c, f, i) Averaged activation curves as calculated from the peak tail current amplitudes under control conditions and in the presence of 10 μM SP (c), 1 nM CA (f) and 100 nM CA (i). In these panels, the continuous lines represent the fit of the data to a Boltzmann equation. In panels b, c, e, f, h, i, squares represent the fractional block as a function of the membrane potential and symbols the mean±s.e.m. of 6 experiments. *P<0.05 vs control; φ, P<0.05 vs data at +40 mV (b, e) or at 0 mV (c). (g) Kv7.1+minK current traces elicited by applying 2-s pulses from −80 to +40 mV and tail currents recorded upon repolarisation to −40 mV in the absence and presence of 100 nM CA. The dashed line represents the zero current level.

