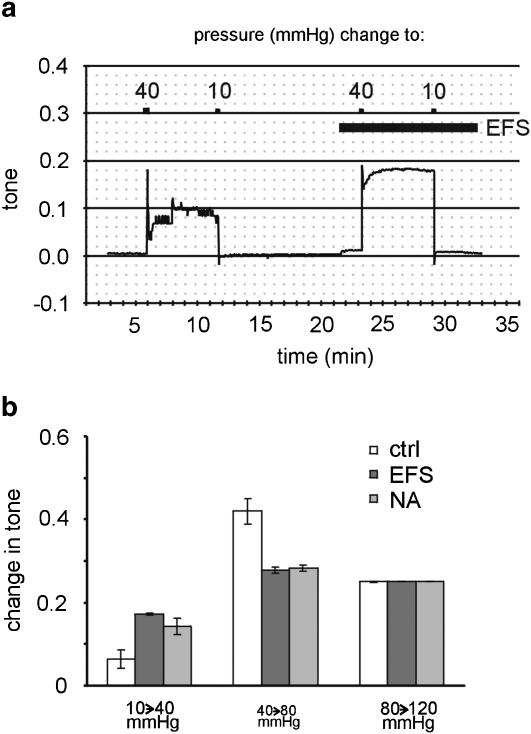
Figure 7.
Changes in calculated vessel tone after different pressure steps. (a) Example of the effect of a pressure change from a starting value of 10 to 40 mmHg and back to 10 mmHg on calculated tone in the absence and presence of EFS (0.1 ms, 10 Hz, 24 mA mm− 2). (b) Changes of calculated tone in response to the pressure steps indicated below the bars in the control (ctrl), during EFS (EFS), and in the presence of noradrenaline (NA); at the steps from 10 to 40 mmHg and from 40 to 80 mmHg, a significantly different effect was observed during EFS and NA compared to control (P<0.05 and P<0.01, respectively); at the other pressure step, no difference was found (P=0.50). The data presented in this figure are based on the data shown in Figure 6.

