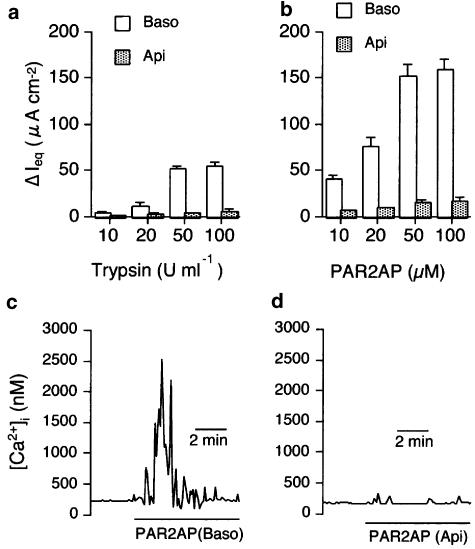
Figure 2.
Comparison of effects of basolateral (Baso) and apical (Api) applications of PAR2 agonists, trypsin (a) and PAR2AP (b), at various concentrations. The ΔIeq was obtained by calculating the difference between peak values after the addition of PAR2 agonists and values just before their addition. Data are means±s.e.m. (n=4). (c, d) Representative tracings of [Ca2+]i changes during exposure to PAR2AP from the basolateral (c) and apical side of the monolayer (d).

