Figure 1.
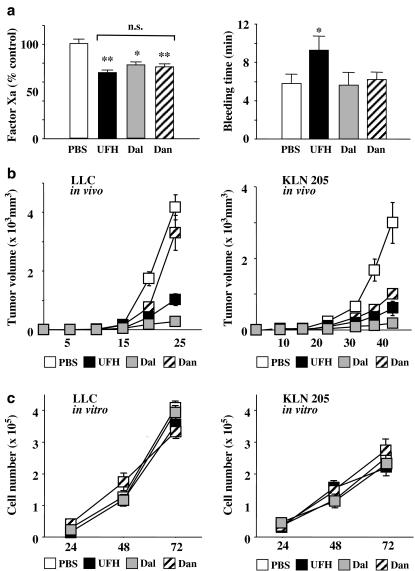
(a) Effects of PSAs on factor Xa activities (left) and bleeding time (right). Mice were injected with PBS (100 μl), UFH (200 units kg−1), dalteparin (Dal; 75 units kg−1) or danaparoid (Dan; 50 units kg−1) for 3 days. Factor Xa activities are expressed as the percentage of the mean of PBS-injected mice (control). *P<0.05, **P<0.01 vs control by Student's unpaired t-test. N.s. (not significant) between PSAs by one-way ANOVA with Fisher's least-significant-difference test. The values represent the mean±s.e. (n=5–7 per group). (b) The tumour volumes in LLC inoculated mice (left) and KLN205 inoculated mice (right). The values represent the mean±s.e. (n=7–10 per group). (c) Proliferation curves for LLCs (left) and KLN205s (right) in vitro in the mediums supplemented with PSAs (10 units ml−1). The values represent mean±s.e. of triplicate wells.

