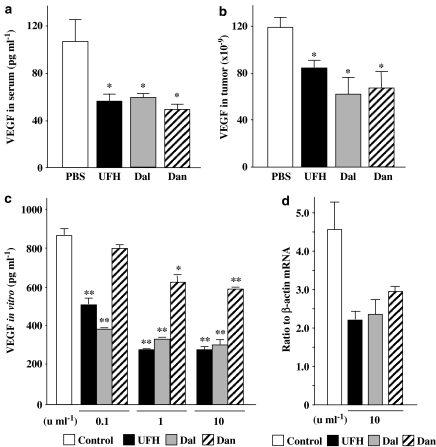
Figure 6.
VEGF protein levels in serum (a) and tumours (b) in mice with KLN205 tumours were quantified by ELISA. The values represent the mean±s.e. (n=5–7 per group, *P<0.05 compared to other groups using one-way ANOVA with Fisher's least-significant-difference test). (c) The VEGF protein levels in KLN205 cell culture medium. The values represent the mean±s.e. of triplicate wells (*P<0.05, **P<0.01 vs control using Student's unpaired t-test). (d) VEGF mRNA in KLN205 cells treated by PSAs. Results of quantitative RT–PCR are expressed as the ratio to β-actin mRNA. The values represent the mean±s.e. of triplicate wells. The data are representative results from three independent experiments.

