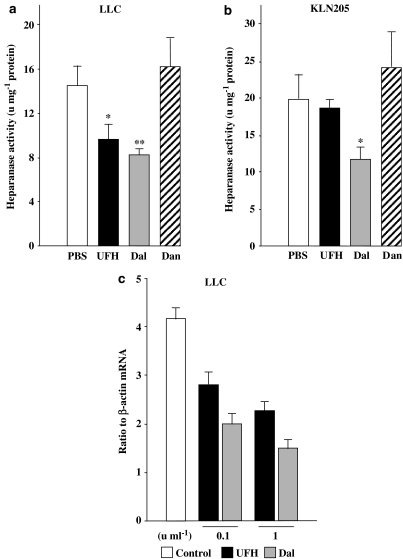
Figure 7.
Heparanase activity in LLC tumours (a) and KLN205 tumours (b). Each value for heparanase activity was normalized to protein concentration (units mg−1 protein) and represents the mean±s.e. (n=5–7 per group). Differences between the two groups were determined by Student's unpaired t-test (*P<0.05, **P<0.01 compared with the PBS group). (c) The heparanase mRNA expression. The values represent the mean±s.e. of triplicate wells. The data are representative results from three independent experiments.

