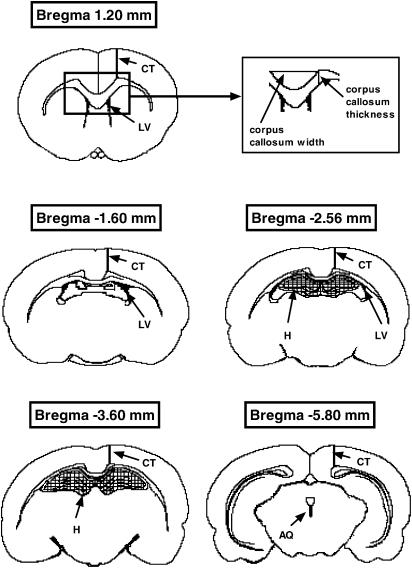
Figure 1.
Diagrams of coronal brain sections at Bregma 1.20, −1.60, −2.56, −3.60, and −5.80 mm, showing the location of structures measured in this study (adapted from Paxinos & Watson, 1998). Cross-sectional area was calculated from the area of the entire section. Location of measurements of CT, and corpus callosum height and width (see inset) are shown as thick lines, areas of the LVs and AQ are shown in black, and the hippocampus (H) is shown cross-hatched (Bregma 2.70 mm not shown).

