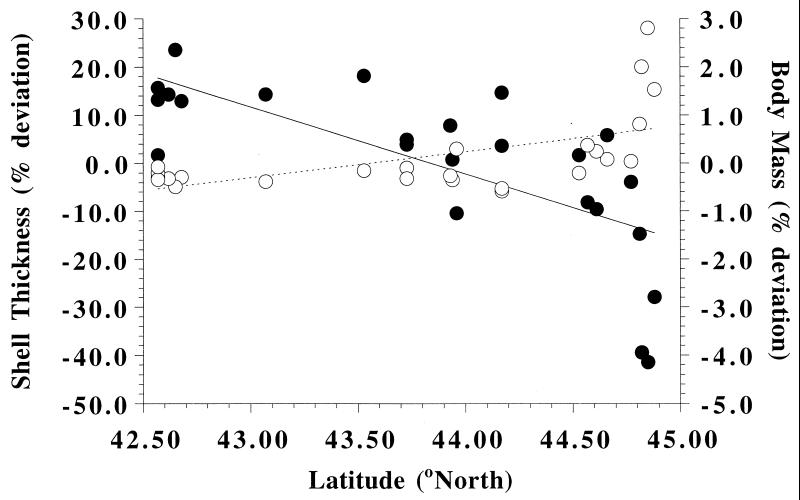
Figure 1.
Shell thickness (±SE; ●) and body mass (±SE; ○) for each of 25 L. obtusata populations as a function of latitude in the Gulf of Maine. Shell thickness and body mass of each snail were expressed as a deviation from a regression of (i) log shell thickness (Y) vs. log shell length (X) and (ii) log body mass (Y) vs. log shell mass (X), respectively, across all populations. Mean shell thickness and body mass were back-transformed for presentation and are expressed as a percent deviation from the appropriate regression. Each mean is based on a sample of 50 snails from each population. Shell thickness decreases with increasing latitude (Y = −13.89X + 608.87, R2 = 0.50, P < 0.0001), and body mass increases with increasing latitude (Y = 0.540X − 23.513, R2 = 0.31, P < 0.005). Error bars are smaller than symbols.

