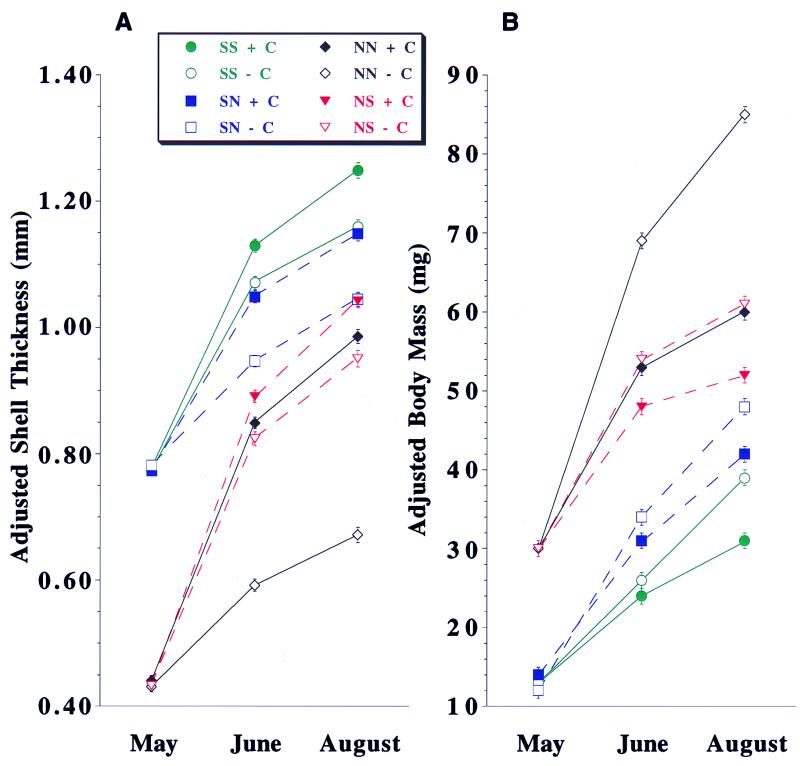
Figure 2.
Phenotypic plasticity in shell thickness (A) and body mass (B) for L. obtusata that were reciprocally transplanted between a southern (S; Manchester, MA) and northern (N; Lubec, ME) site and exposed to the presence (+C; solid symbols) or absence (−C; open symbols) of C. maenas effluent. Data are least squares-adjusted means (±SE) generated by ANCOVA (see Methods) for shell thickness (Y) vs. shell length (X) (A) and body mass (Y) vs. shell mass (X) (B). At each location, snails from each source population produced significantly thicker shells after 45 and 90 days (both P < 0.0001, ANCOVA) and significantly less body mass after 45 and 90 days (both P < 0.0001, ANCOVA) when raised with C. maenas. See Table 1 for linear contrasts. SS, South to South (green, solid line); SN, South to North (blue, dashed line); NN, North to North (black, solid line); NS, North to South (red, dashed line). May, initial phenotypic values; June, midpoint phenotypic values (45 days); August, final phenotypic values (90 days).

