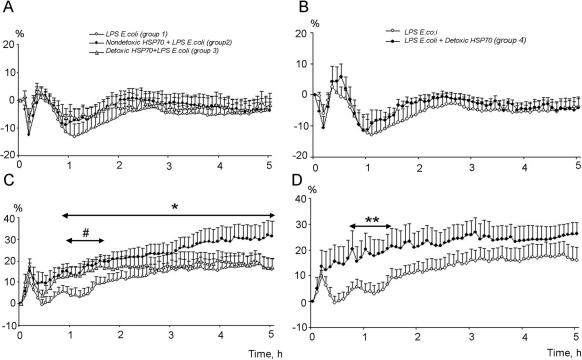
Fig 5.
Patterns of mean arterial pressure (MAP) (A) and heart rate (B) after administration of E coli LPS only (group 1) and resulting from prophylactic action of Hsp70-ND (group 2) and Hsp70-DT (group 3); and patterns of MAP (C) and heart rate (D) after administration of E coli LPS (group 4) and after therapeutic administration of Hsp70-DT introduced after E coli LPS injection (group 5). *Indicates statistically significant differences (using ANOVA 2 method) between groups 1 and 2. #Indicates statistically significant differences (using ANOVA 2 method) between groups 1 and 3. **Indicates statistically significant differences (using ANOVA 2 method) between groups 4 and 5

