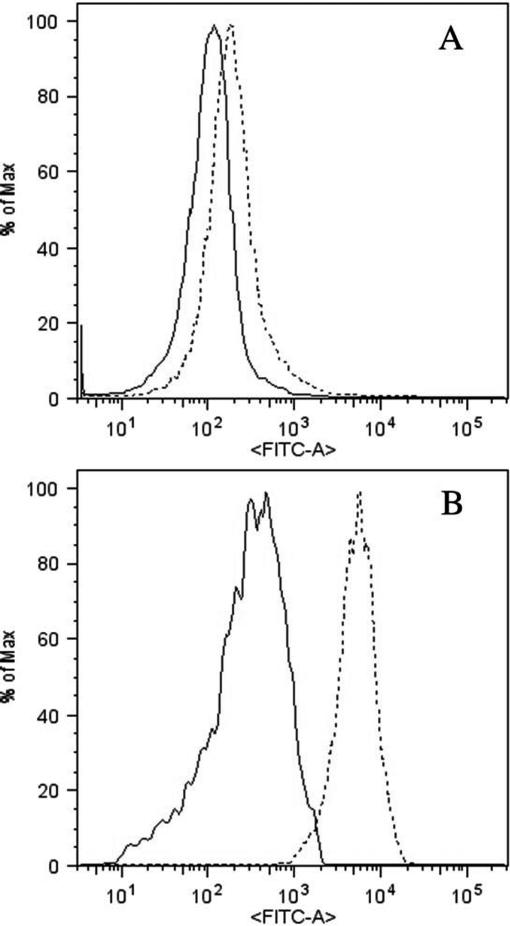
Fig 3.
Histograms of the cell-specific induction of Hsp70 in lymphocytes (A) and monocytes (B) by FACS. The solid peak corresponds to the non–heat-shocked (basal) level, whereas the dashed peak corresponds to the heat-shocked (induced) level of Hsp70, depicted by the FITC signal. Both the basal and heat-shocked levels of Hsp70 are higher in monocytes than in lymphocytes. Also, more Hsp70 is induced in monocytes than in lymphocytes

