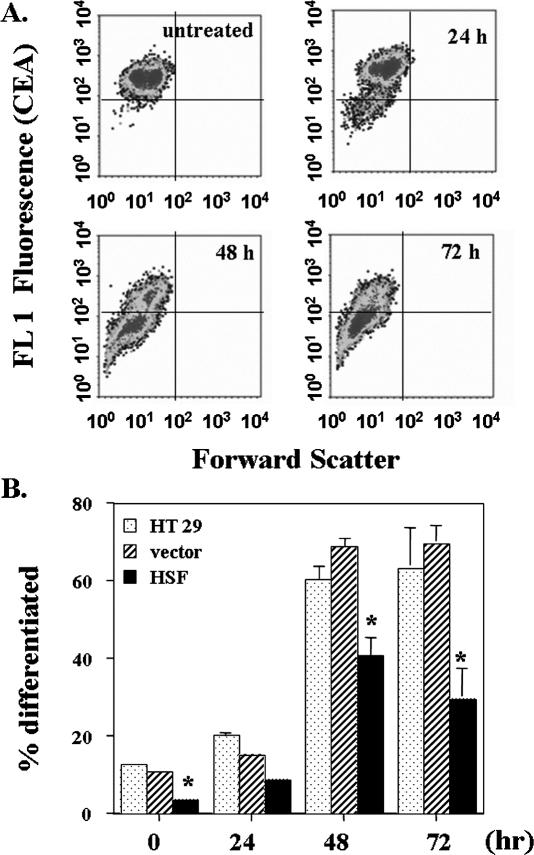
Fig 5.
Measurement of carcinoembryonic antigen (CEA) expression in response to exposure to 3 mM butyrate for various periods of time. A rabbit anti-human CEA antibody was used to label the CEA expression on the cell surface. Flow cytometry data showed a population of cells with lower CEA expression (lower left quadrant) after butyrate treatment (A) that were considered differentiated cells; (B) quantification data. The data presented are the average of 3 separate experiments (mean ± SE). Statistical differences were determined by 1-way ANOVA. Once significance was reached, Dunnett's multiple comparisons was used to compare between nontransduced HT 29 parental cells and cells transduced with either vector alone or with HSF1; * P < 0.05

