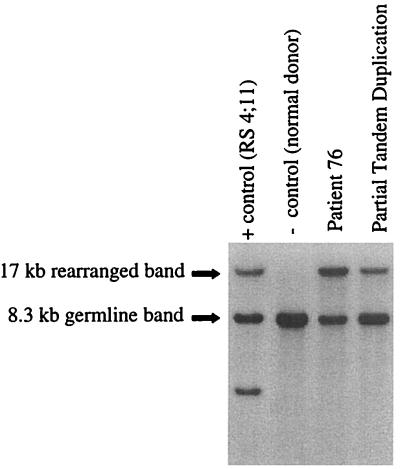
Figure 1.
Southern analysis of an AML cell line, a normal donor, and two patient bone marrow samples. This blot was made from BamHI-digested DNA and hybridized with the B859 probe. A germ-line MLL 8.3-kb band is seen in each sample. In the positive control RS4;11 cell line, two rearranged bands are seen in addition to the germ-line band. Each band represents one portion of the translocation. The second lane is a normal donor negative control. In the last two lanes, both patient 76 and the PTD show a single 17-kb rearranged band. However, the 17-kb band in the patient 76 lane shows greater intensity relative to the germ-line band unlike the rearrangement seen with the PTD.

