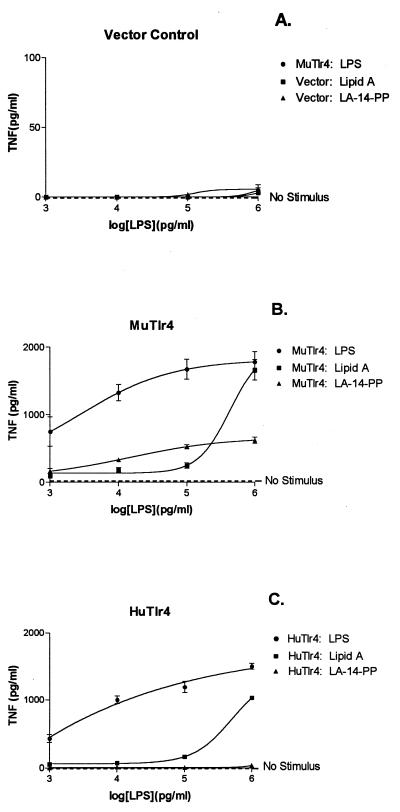
Figure 4.
Responses of MTC3H/HeJ cells to LPS and LPS partial structures: effect of Tlr4 species origin. (A) MTC3H/HeJ cells transfected with vector control. (B) MTC3H/HeJ cells transfected to express mouse Tlr4. (C) MTC3H/HeJ cells transfected to express human Tlr4. Each point represents the mean of four TNF assays, and error bars reflect SD. Curves were drawn to fit a one-site hyperbola model by using prism 3.0. Note that the y axis in A is drawn to a different scale than in B and C to highlight the complete nonresponsiveness of the control-transfected cells. The dashed line parallel to the abscissa indicates the level of TNF produced without the addition of any ligand (No Stimulus).

